Tinder × Gen Z

Rebuilding relevance, trust, and connection for Gen Z

A semester-long UX research project with Berkeley Innovation, partnered with Tinder to understand how Gen Z defines dating today, what safety means for Gen Z women, and how Tinder competes in an evolving landscape.

My Role
Ideation Lead
Timeline
Spring 2026
Team
5 people
Partner
Tinder
Type
UX Research · Product
📷 Hero Image
Main project cover photo
Replace with: <img src="images/tinder-hero.jpg">
Hero — e.g. team photo, event photo, or project overview graphic
01 — overview

What was this project?

My Role 03 — Ideation Lead

This was a semester-long consulting engagement through Berkeley Innovation — UC Berkeley's human-centered design club — partnered directly with Tinder. Our five-person team was tasked with understanding Gen Z's relationship with dating apps and generating product opportunities for Tinder to rebuild relevance with their most important future user group.

As Ideation Lead, I was responsible for synthesizing our research findings into actionable product concepts — translating insights from 20+ interviews, 6 focus groups, and 115 survey responses into concrete design opportunities.

115
Survey responses from Gen Z users
20
In-depth user interviews conducted
6
Focus groups facilitated across campus
UX Research Survey Design Affinity Mapping Ideation Competitive Analysis Diary Study

02 — problem

What problem were we solving?

Tinder is the world's most popular dating app, but its relevance with Gen Z is slipping. Gen Z — the next generation of daters — is facing a loneliness epidemic while simultaneously rejecting the very platforms designed to help them connect.

"How might we explore how Gen Z defines dating today, what safety looks like for Gen Z women, and how Tinder is perceived among competing dating apps?"

Our competitive analysis surfaced a broader industry shift — away from swipe-based, profile-first interactions toward IRL-first, experience-driven connection:

  • Group-based interactions over 1:1 matching
  • Platforms handling event logistics and planning
  • Reduced emphasis on profiles, messaging, and browsing
  • Rising demand for authentic, low-pressure connection

03 — research

How did we understand Gen Z?

We used a multi-method approach to triangulate findings across quantitative and qualitative sources.

01 — quant
Survey
115 responses, 93% aged 18–26. Measured dating intentions, app perceptions, trust behaviors, and meeting preferences.
02 — qual
Interviews
20 in-depth interviews (75% women) exploring how Gen Z navigates romance, safety, and connection through lived experience.
03 — group
Focus Groups
6 focus groups to surface shared behaviors and social dynamics. Participants built on each other's experiences.
04 — longit.
Diary Study
Tracked how Gen Z users experience dating over time — how intentions, trust, and emotions evolve from match to post-date.
05 — field
On-Campus Tabling
In-person outreach yielding 50+ responses and mini-interviews. 31% of respondents identified as LGBTQ+.
06 — product
Product Immersion
Downloaded and actively used Tinder to understand core flows, usability gaps, and interaction patterns firsthand.

04 — on-campus tabling

Getting out into the field

We ran in-person outreach on campus to increase survey volume and recruit participants for interviews and focus groups — reaching demographics we wouldn't have captured online alone.

📷 Photo 1
Tabling — photo 1
tabling-1.jpg
On-campus tabling
📷 Photo 2
Tabling — photo 2
tabling-2.jpg
On-campus tabling
📷 Photo 3
Tabling — photo 3
tabling-3.jpg
On-campus tabling

Results: 50+ survey responses, 3 mini interviews/focus groups. 73% of respondents identified as female, 5% as non-binary or transgender, 31% as part of the LGBTQ+ community.


05 — profile card event

What if profiles had no constraints?

We ran a Figma Design Workshop led by UC Berkeley's Figma campus ambassadors — giving participants a blank canvas to design their own dating profile with no template restrictions. This revealed how Gen Z actually wants to present themselves.

📷 Event Photo
Profile Card Event — wide shot
profile-event-wide.jpg
Figma design workshop at UC Berkeley
📷 Profile Card 1
Student-designed profile example
profile-card-1.jpg
Participant profile card — example 1
📷 Profile Card 2
Student-designed profile example
profile-card-2.jpg
Participant profile card — example 2

Key finding: Participants valued open-ended prompts enabling more authentic self-expression beyond traditional dating app constraints. They expressed identity through personal interests, aesthetics, and visuals — creating more unique and personalized profiles.


06 — synthesis

Making sense of all the data

After collecting data across all six methods, we ran affinity mapping sessions to cluster findings into themes — surfacing the patterns that cut across interviews, surveys, and focus groups.
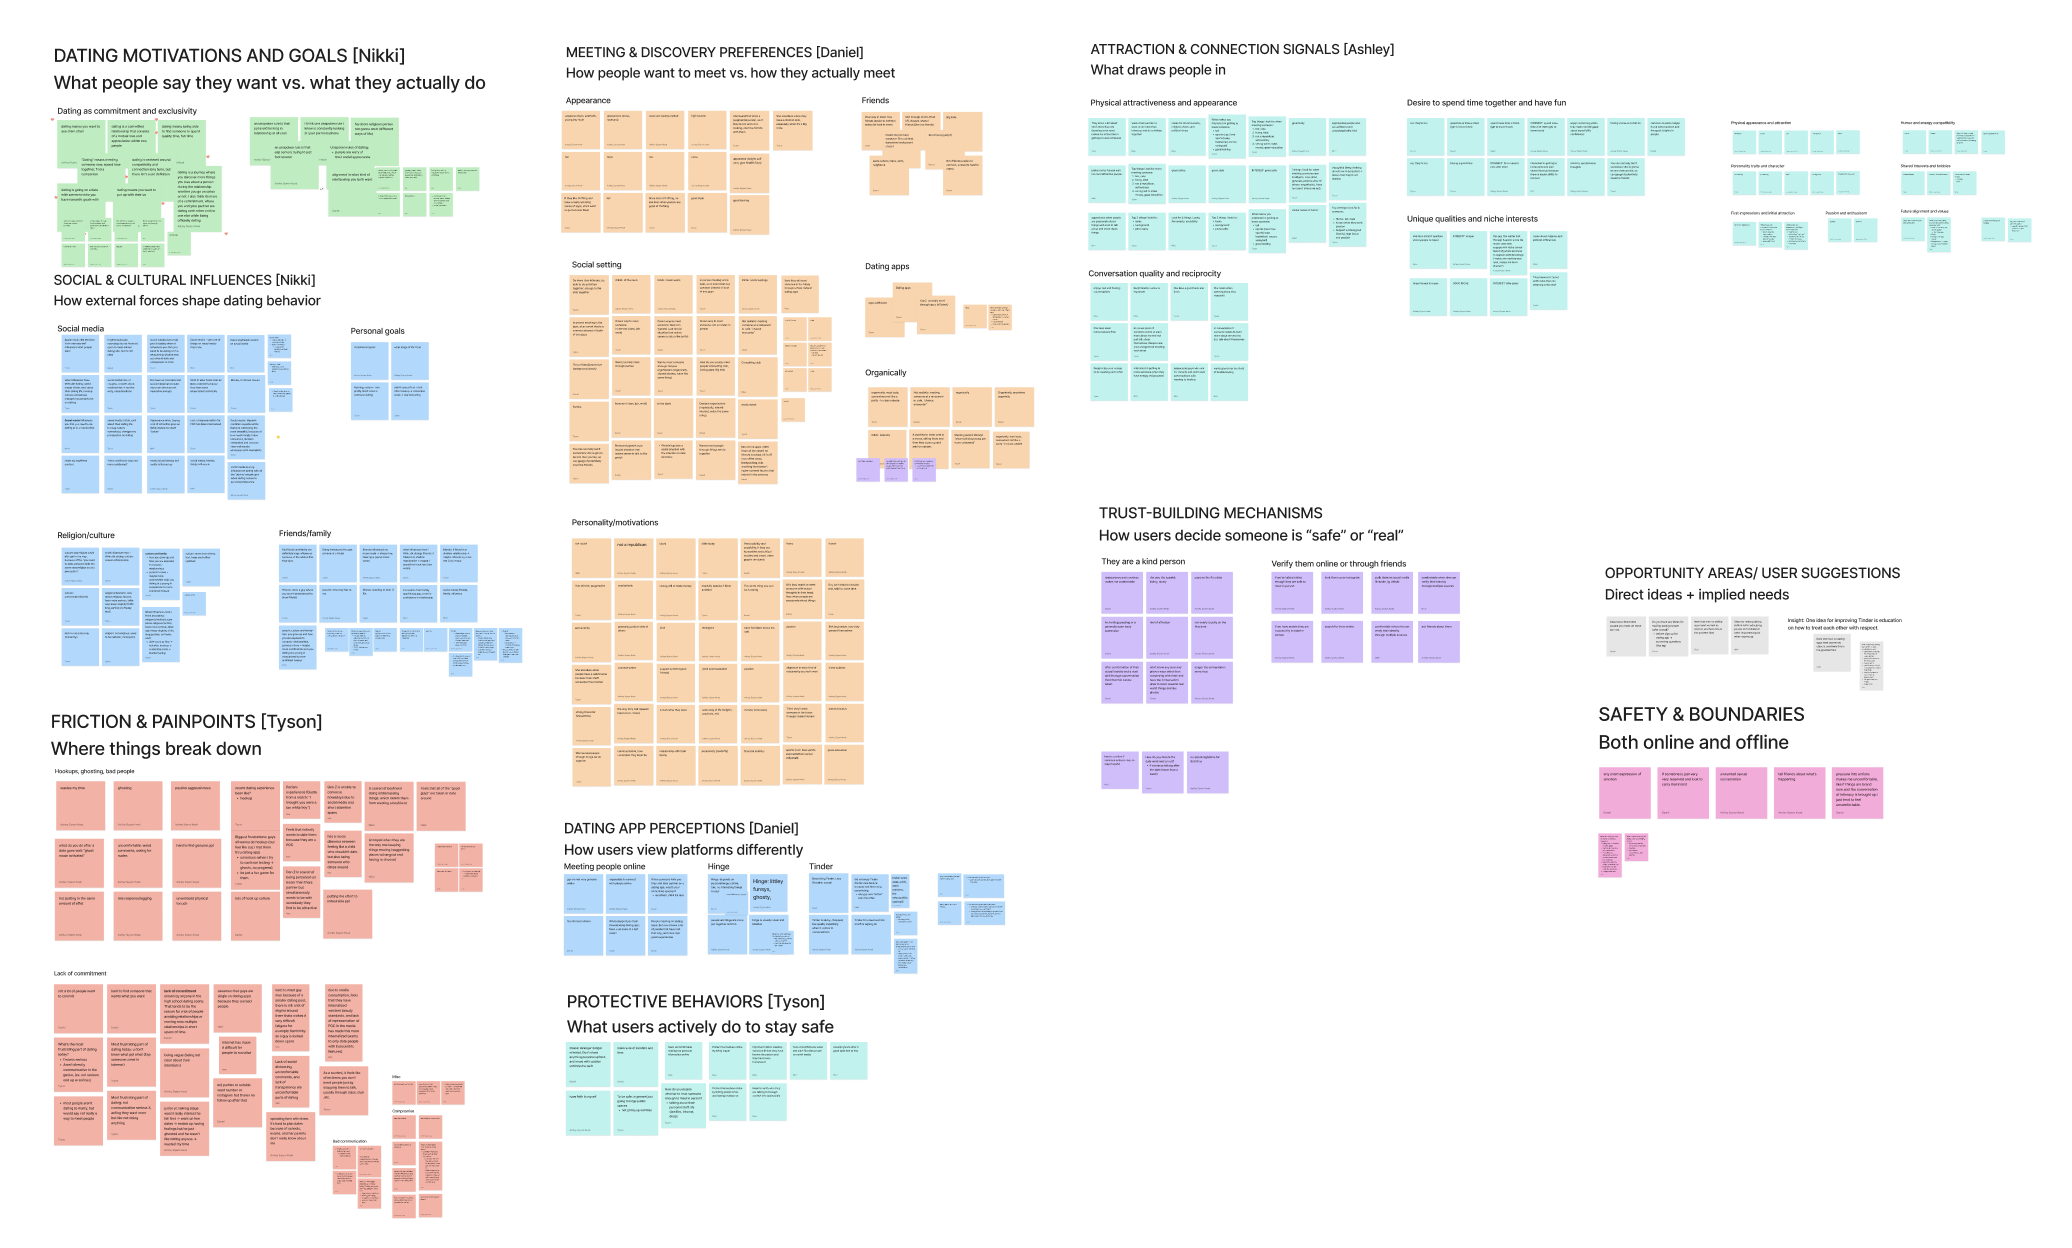
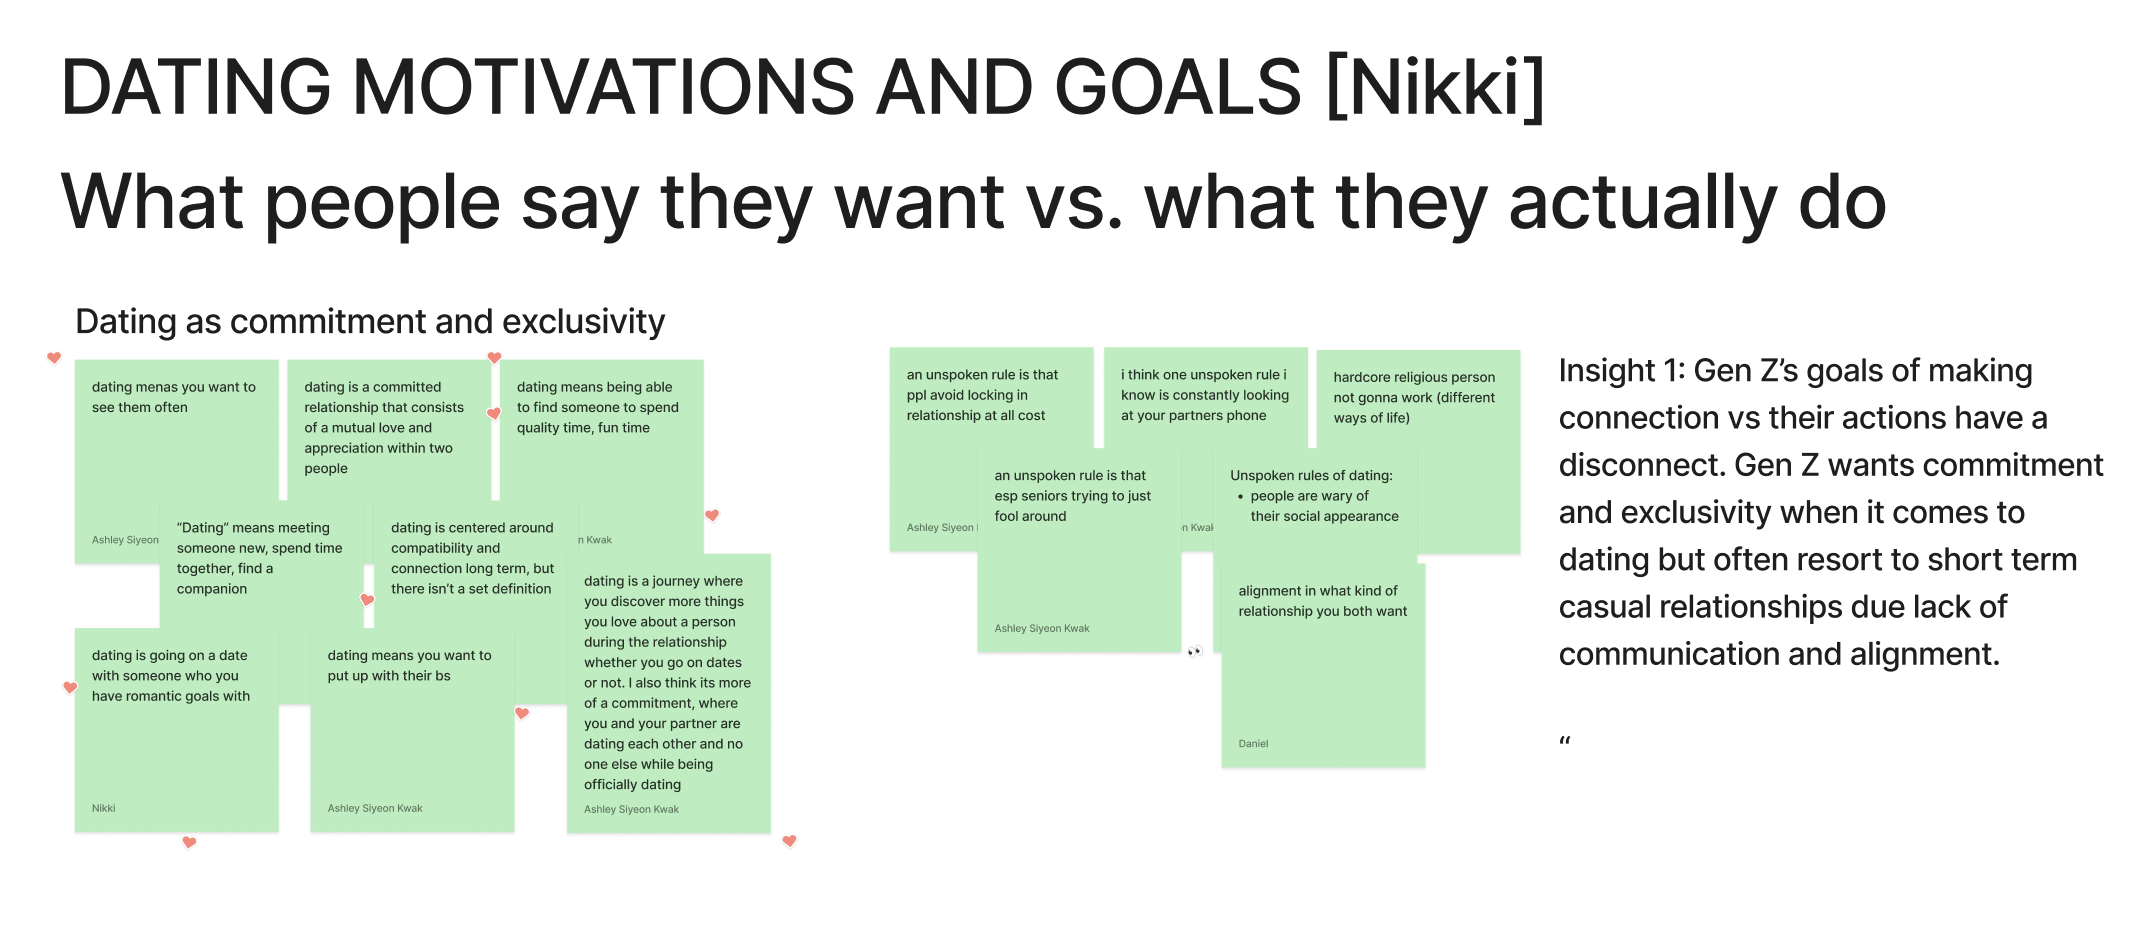
Full affinity map — synthesis session in FigJam
Affinity mapping session — clustering 100+ data points into themes
Affinity map — cluster detail: dating motivations
Theme cluster: dating motivations
Affinity map — cluster detail: trust and safety
Theme cluster: trust and safety

07 — insights

What did we find?

From 115 survey responses, 20 interviews, and 6 focus groups, we synthesized 4 key insights that shaped our ideation direction.

Insight 01 — Motivations
The Intention vs. Behavior Gap
52.4% of users want long-term relationships, but 56.5% perceive Tinder as casual. A fundamental misalignment between user intent and platform perception.
"An unspoken rule is that people avoid locking in(to) a relationship at all costs"
Insight 02 — Connection
Attraction Through Shared Activity
A major driver for Gen Z to make connections is the desire to spend time together over shared activities — not profile browsing or text-based chat.
"I'm interested in getting to know someone with a shared interest because it is easier to connect"
Insight 03 — Discovery
In-Person Is the Default
87.8% prefer meeting at in-person events, 81.7% through mutual friends. Only 9.6% prefer dating apps. Apps are a fallback, not a first choice.
"An in-person meeting is the best, at an event that is a common interest of both of us."
Insight 04 — Friction
Closing the Gap Is the Hardest Part
The biggest frustration isn't finding a match — it's the gap between matching and dating. Commitment issues and poor communication block progression.
"People act like they want more but like not doing anything."

08 — user journey

The emotional arc of a Gen Z dater

Our diary study tracked Gen Z users through the full dating arc — from downloading the app to post-date reflection. The emotional journey revealed persistent uncertainty at almost every stage.

📷 Journey Map
Emotional journey map from diary study
journey-map.jpg  ·  recommended: full-width screenshot from your deck
Emotional journey map — Entry → Match → Trust Building → In Person → Post Date

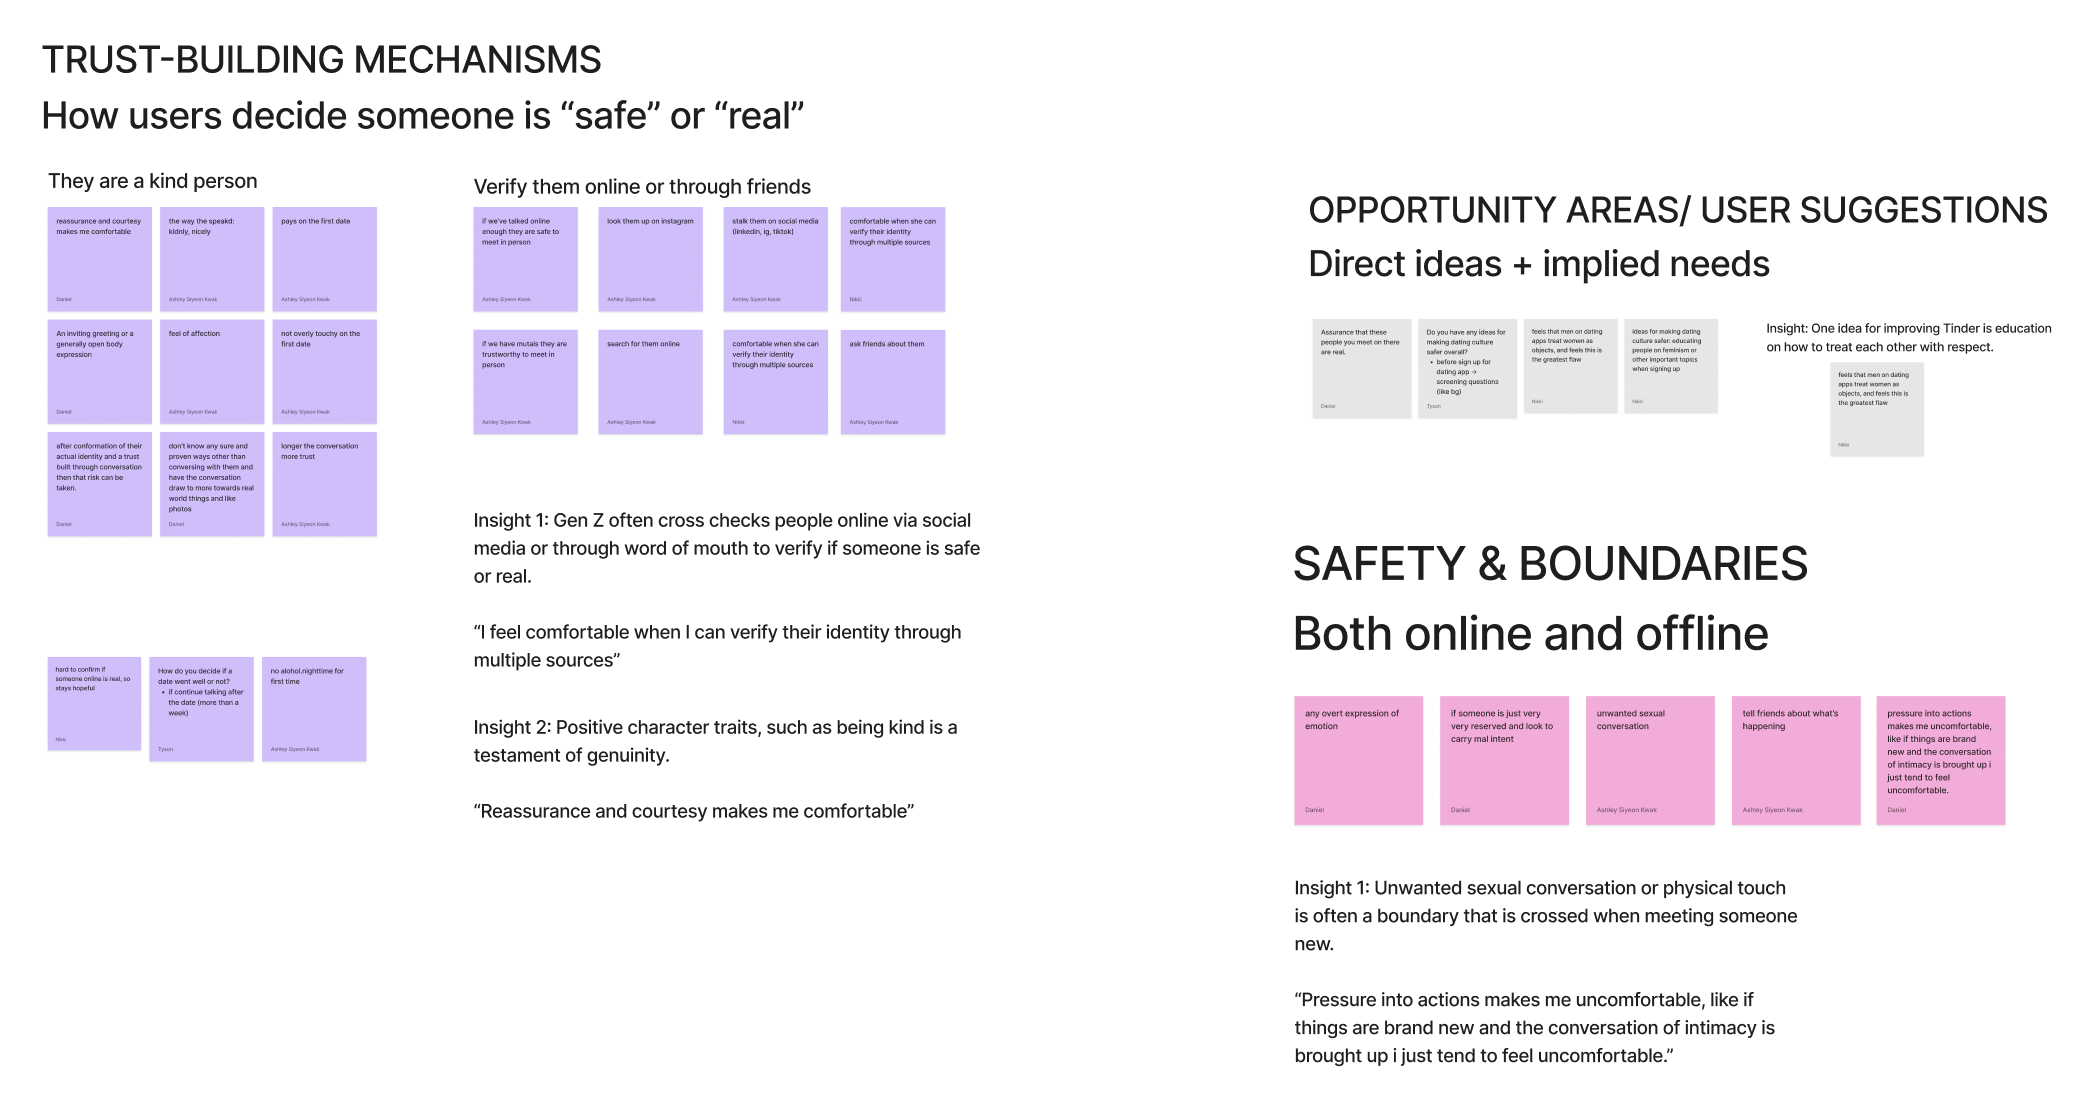
Key pattern: Trust doesn't build on Tinder — it builds off-platform. Moving to Instagram is the real trust signal. Consistency in communication signals genuine intent. Even good dates lead to second-guessing.


09 — ideation

What did we propose?

As Ideation Lead, I synthesized our research into 4 product concepts for Tinder to explore. Each concept directly addresses a specific insight cluster from our research.

01
Dating Intentions Setting
Allow users to select dating intentions upfront — helping tailor matches and creating a more aligned, comfortable experience. Directly addresses the intention vs. behavior gap.
02
Tinder Groups + Events
Interest-based group spaces where users connect over shared hobbies in moderated, low-pressure environments. Groups integrate with events, shifting from profile-first to experience-first.
03
Timed Re-engagement Prompts
Prompts introduced after conversation inactivity to spark new topics, helping re-engage users and reduce ghosting — addressing the drop-off between matching and meeting.
04
Tinder Education Onboarding
Brief onboarding content around respectful behavior and communication, setting clear expectations early — helping rebuild Tinder's perception among Gen Z women who cited safety as a top concern.

10 — reflection

What did I take away?

This project pushed our team to slow down and truly understand people's experiences before jumping into solutions. Through all our research, we started to see the real emotions, motivations, and challenges behind how people use these platforms — which made our work feel personal and intentional.

As Ideation Lead, the biggest challenge was resisting the urge to generate ideas too early. The discipline of sitting with the data, finding the real tensions, and only then translating them into concepts was a skill I developed significantly through this project.

Key learning: The best product ideas don't come from feature brainstorming — they come from understanding what users are actually trying to do vs. what the product currently makes them do. That gap is where the opportunity lives.

The team:

Lead
Adriana Alcasabas
Project Mentor
Data Science & Cognitive Science
01
Tyson Gan
Research Lead
Data Science & Design
02
Nikki Krishnan
Synthesis Lead
Cognitive Science & Data Science
03
Daniel Park
Ideation Lead
Data Science & Cognitive Science
04
Ashley Kwak
Prototyping Lead
English & Media Studies
Next project
Project Title Two →